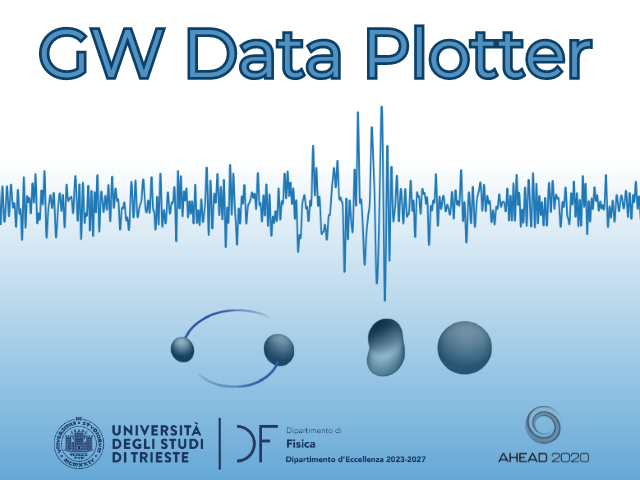
GW Data Plotter: desktop app to simplify access to Gravitational Wave data

Accessing data published by a scientific community can sometimes be difficult both for researchers belonging to other communities and for students wishing to enter the world of research. The development of the GW Data Plotter Desktop application stems precisely from the desire to break down this barrier by means of a graphical interface that allows access to data without any need to write lines of code. For this app the “data” are those recorded by Gravitational Wave detectors. Gravitational Waves are ripples in spacetime caused by violent and energetic processes in the universe, such as the merger of two Black Holes or Neutron Stars.
The app was developed by Agata Trovato and Panagiotis Iosif, two researchers of the Physics Department of the University of Trieste, and is part of the European project AHEAD2020. The executable file can be downloaded from this webpage (https://zenodo.org/records/13778828) and run directly on your PC.
GW Data Plotter allows data recorded by the LIGO, Virgo, KAGRA and GEO Gravitational Wave detectors to be downloaded in various ways: by time interval, by choosing known gravitational wave events or periods of transient noise mimicking signals of astrophysical origin. Data can be saved on the user’s PC for later re-use. The user can visualise the downloaded data either in the form of plots of the data over time or two-dimensional plots showing the frequency evolution of the data over time. Finally, the user can select a gravitational wave event and inspect its astrophysical parameters and skymap (the event’s localization on the celestial sphere), or plot the parameter distributions of all the events recorded so far.
Try the app and let us know!
You can write your comments on this page by clicking on “new issue”: https://github.com/camurria/GW_Data_Plotter/issues


